Reduct As-Built Check Services

Reduct As-built data

by Reduct


Reduct As-built data


The most cost-effective way for utilities to ensure independent, consistent and accurate as-built data for trenched and trenchless network infrastructure.


The as-built accuracy dilemma


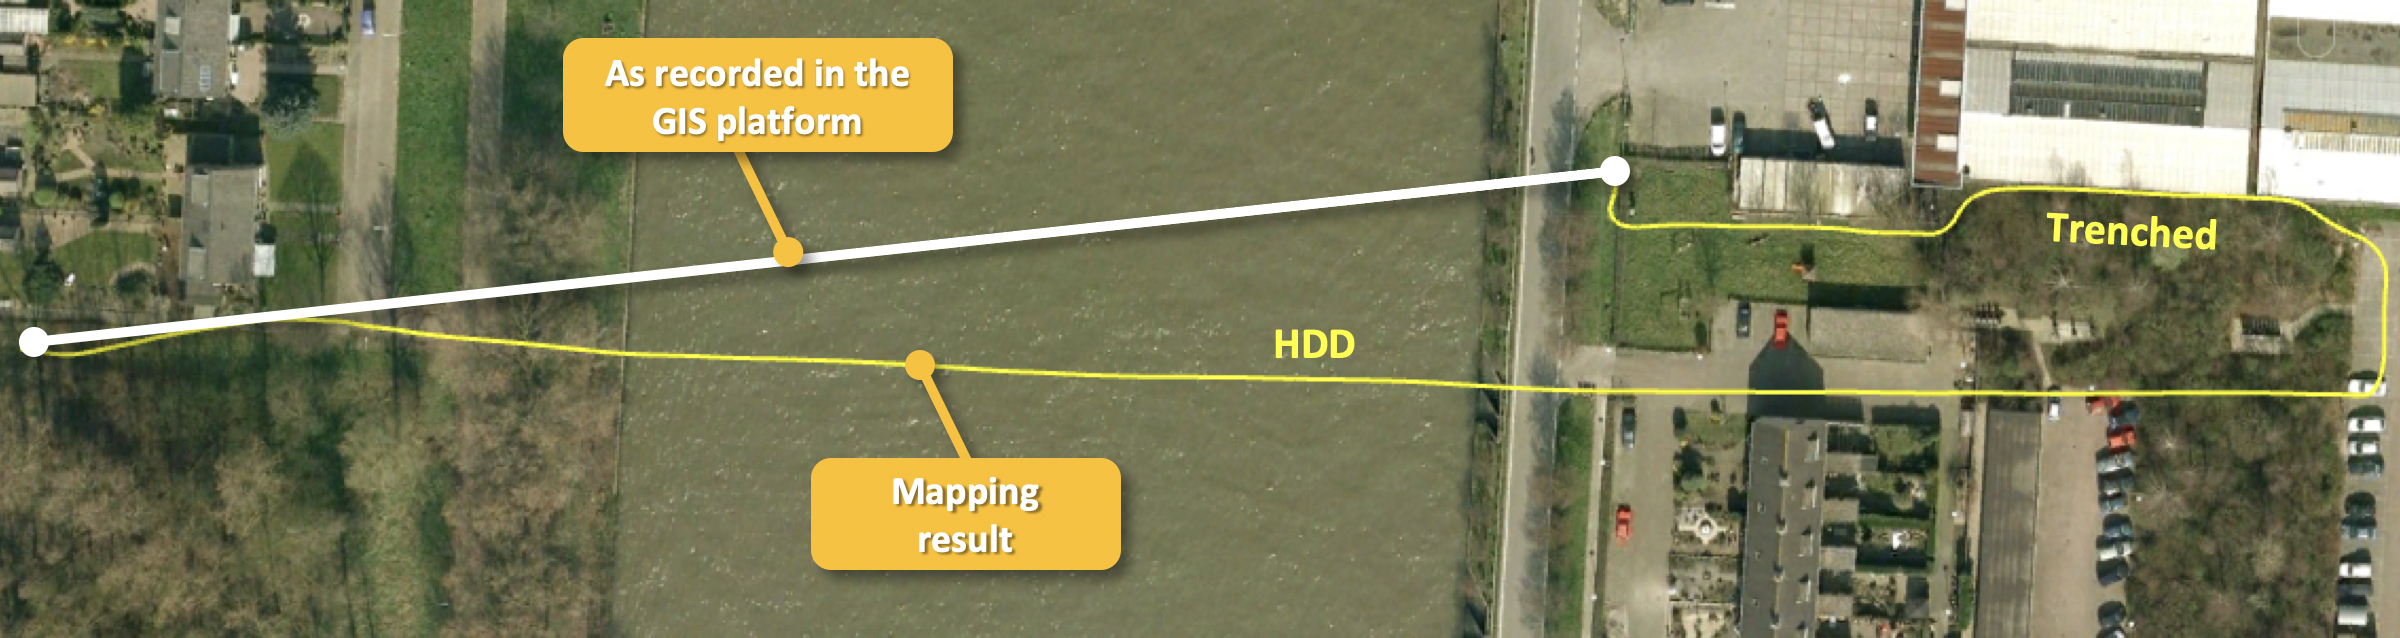
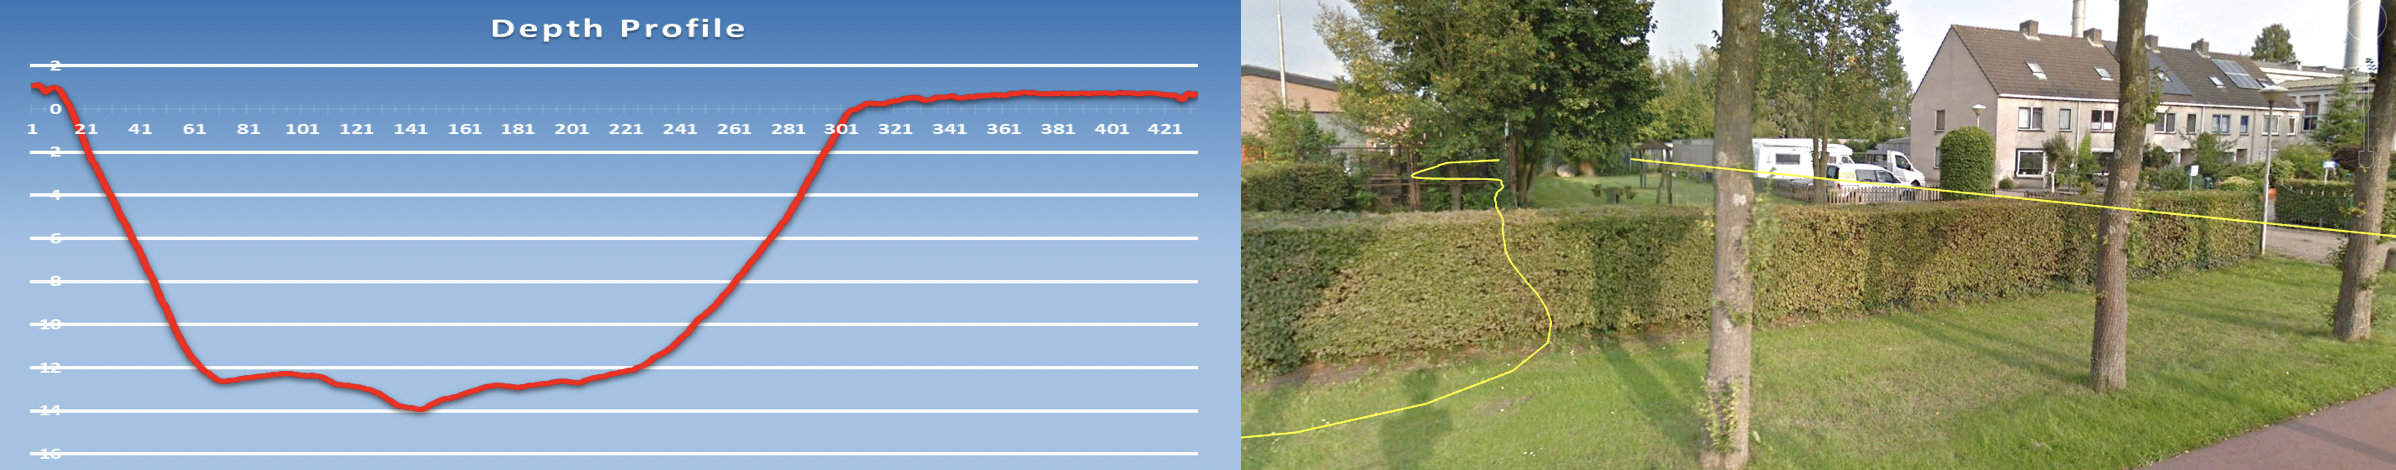
Accurate as-built maps are essential for the safety and integrity of underground utility networks. When awarding new network installation projects to contractors, utilities expect or assume they will receive post-installation as­built data. However, that is not always the case, particularly when the utility’s tender document is unclear about the as-built accuracy or the measurement method to be used. When left open for interpretation, inaccurate as-planned data, or worse, end up in the GIS platform.


However, many utilities are reluctant to tighten as-built accuracy or method requirements in tenders because they do not have the means to implement a Quality Assurance and Control (QA/QC) process to verify the requirements.


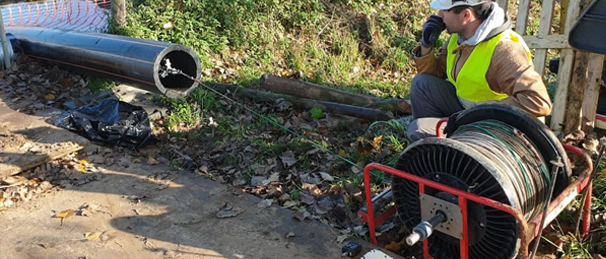
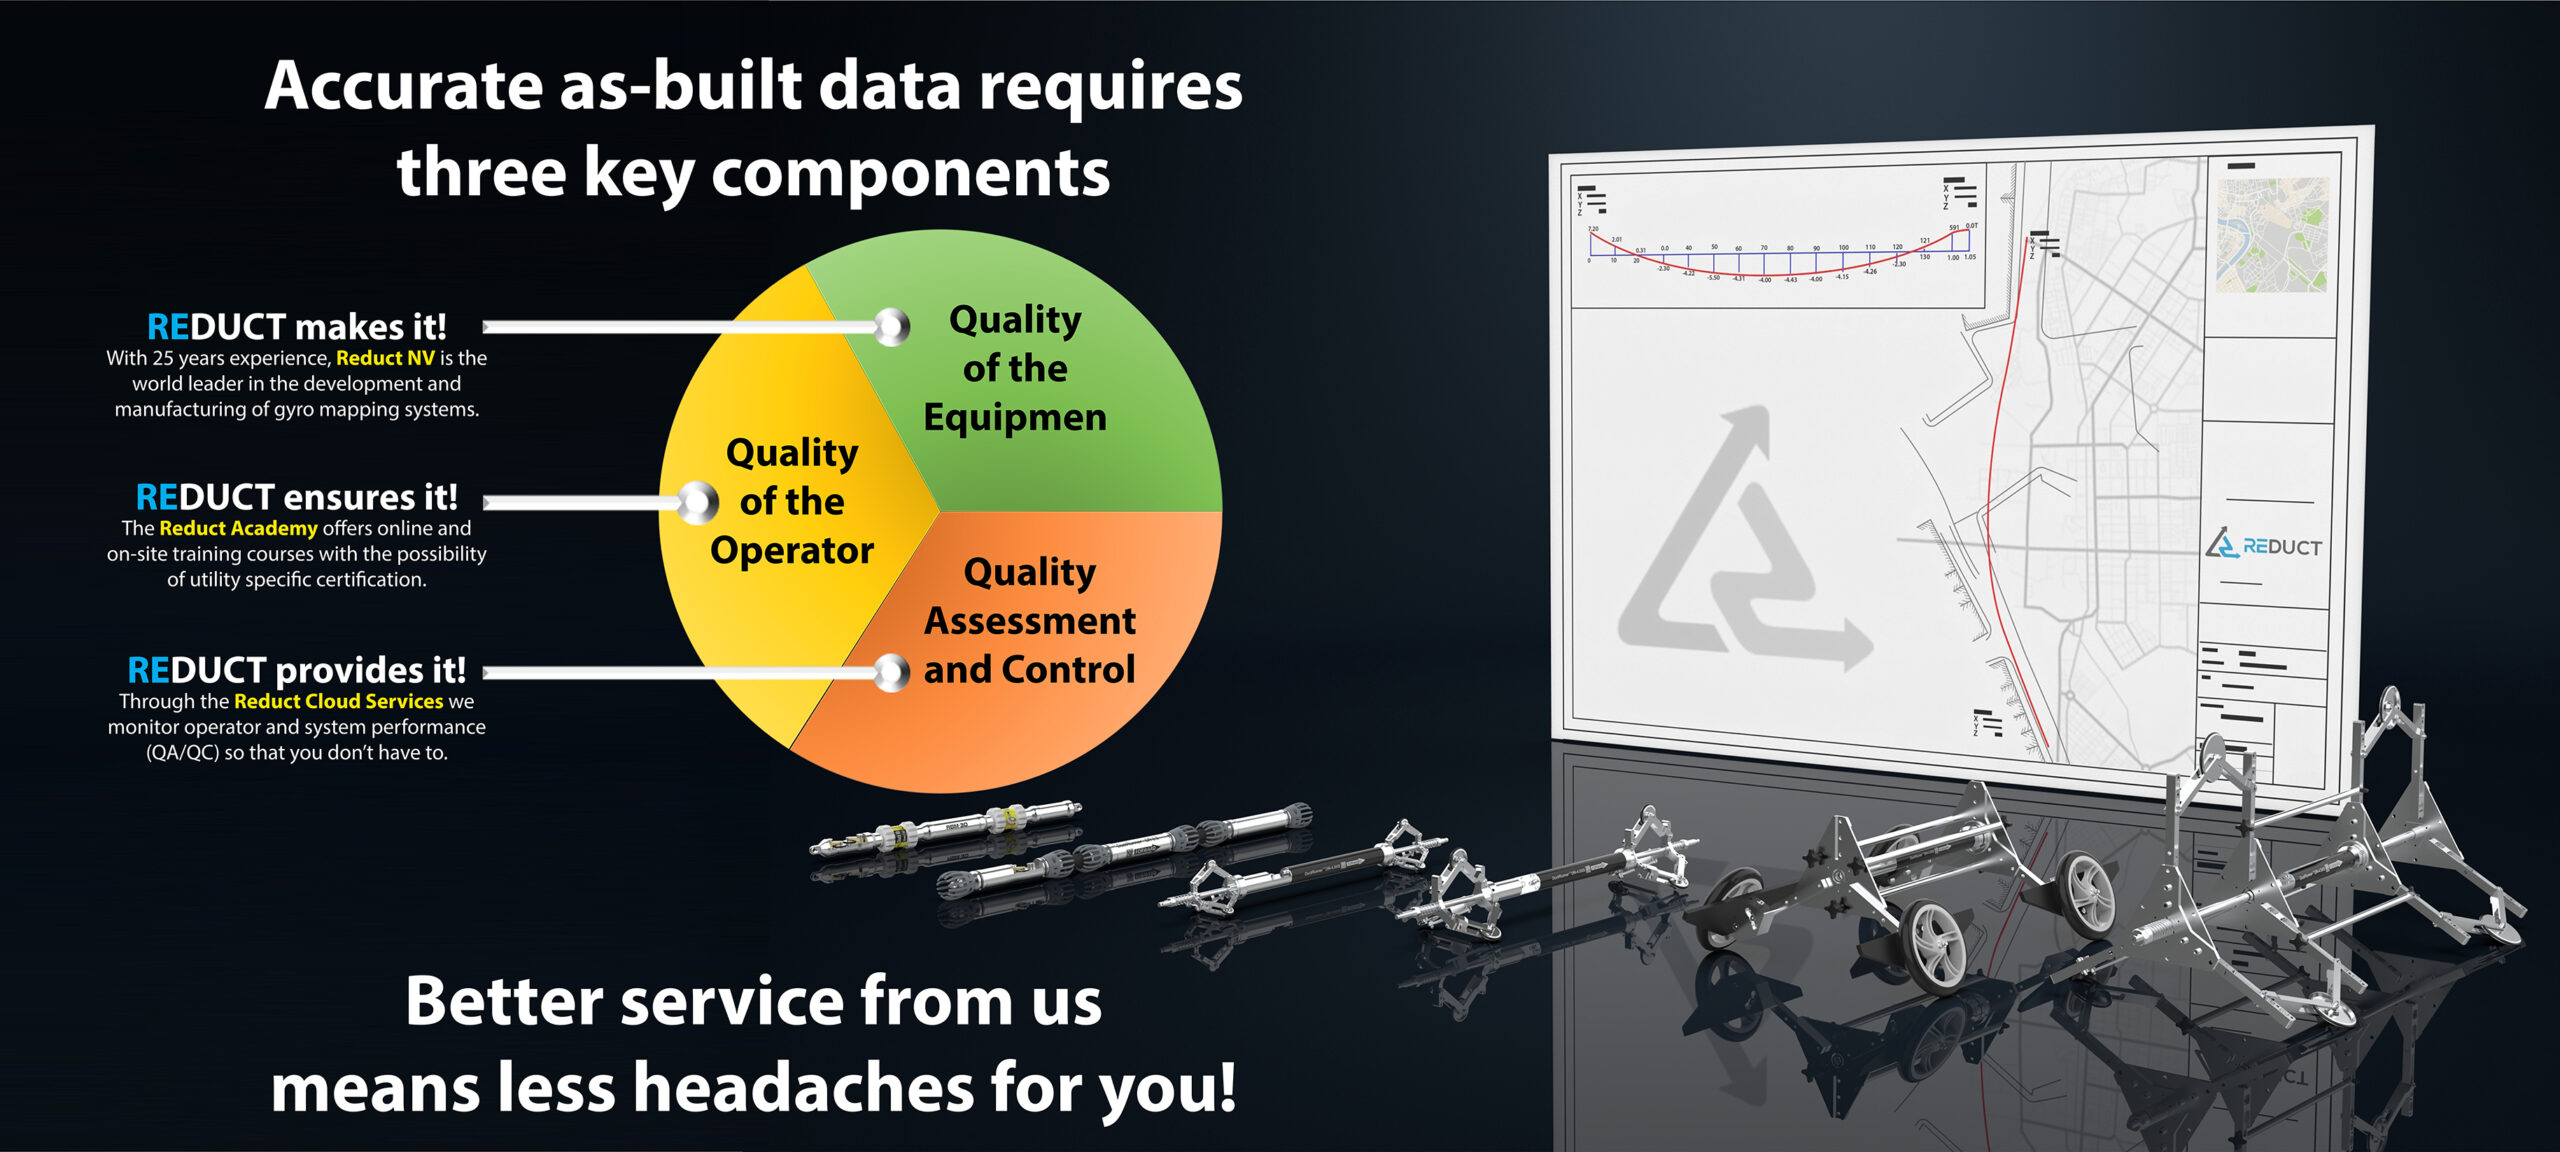
Recognizing this dilemma, Reduct Cloud Services has introduced the As-Built Check (ABC) service. The ABC service integrates technology, training, and quality control into a one-stop concept. The utility only needs to amend the as-built requirement clauses in their tender documents for new build trenched and trenchless network installations. Reduct will equip and train the designated contractors with the appropriate gyro­mapping technology. Once operational, Reduct experts can remotely monitor the performance of each measurement, operator, and mapping tool. Daily or weekly reports can be sent to the utility.


The ABC service is offered on a per-meter or foot basis.


Reduct desktop


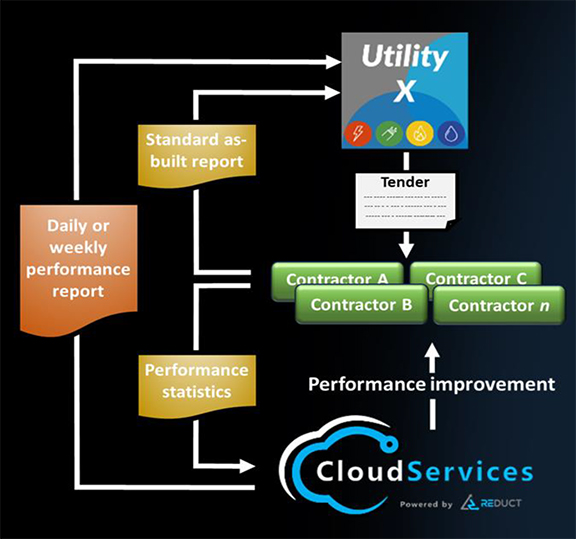
How the As-Built Check service works


Interaction with the utility


• The utility adds accuracy and method specifications to the new-build tender document.

• The contractor delivers the as-built report as usual.

• Simultaneously, performance data are sent to the Reduct Cloud for quality assessment.

• The utility receives a daily or weekly performance quality report for all installation activity since the previous report, and, if necessary, recommended or planned remedial actions.


Interaction with the contractors


• Each contractor receives performance reports per measurement, unit or operator.

• Reduct QA/QC experts will suggest procedural changes, additional training, or other performance-enhancing measures when necessary.

• Reduct QA/QC experts will liaise with product engineers to implement mechanical adjustments to the equipment to improve performance further.


Reduct as-built diagram


Contact your Territory Manager for more information on Reduct pipeline mapping tools, or visit www.egwutilitysolutions.com/reduct.


Take no risk, get it mapped!


Reduct Case Study – Steel pipe bend radius verification (1000xD Rule)

Reduct case study 5

by Reduct

Pipe Material: Steel

Pipe Size: 12.7″ OD

Pipe Length:  427′

Pipe Depth: 15′

Product:

Reduct DR-4


When installing pressurized steel pipes, the long-term integrity of the pipe is paramount. Wall thickness and bend specifications typically follow industry ‘rules of thumb’. The 1000xD rule for steel pipe HDD installations is one of them. This rule states that the bend radius of a (straight section) pipe must be at least 1000 times the pipe’s diameter. Engineers specify the wall thickness and other properties of the pipe based on this rule, and a bend radius smaller than 1000xD could lead to higher than desired stress on the pipe. Higher stress equals higher risk.


Reduct case study 5


Because the DuctRunner technology logs at 100Hz frequency (100 samples per second), the 2D and 3D bend radius of a pipe can be accurately determined. In this case, an HDD curve was designed to comfortably meet the 1000xD rule. However, the depth profile of the Reduct measurement reveals that the actual curve deviates significantly from the design, particularly between 40 and 70 meters of bore length.


The pipe in this case study has a diameter of 323mm. Following the 1000xD rule a minimum radius of 323m should be observed (black dashed line). Using the X-View bend radius calculator, the minimum radius observed is only 190m. A radius of 190m is equal to about 590xD, a serious undercutting of the Industry Standard specification. As a result, the pipe did not pass the customer’s safety specifications and had to be removed and re-drilled by the contractor.


For more information on the Reduct DR-4, click here.


Reduct Case Study – Beware of Straight-line HDD As-built Data in Your GIS platform

Reduct Case Study 4

by Reduct

Pipe Material: HDPE

Pipe Size: 1.5″ ID

Pipe Length:  1,416′

Pipe Depth: 45′

Product:

Reduct DR-2


Reduct case study


A telecom utility was requested to provide duct depth information to the waterway authorities ahead of a planned deepening of the canal that the duct crosses. The utility owner realized that for this particular HDD crossing, the data stored in their GIS platform was unreliable, so they commissioned a gyro survey.


The mapping result proved this to be a wise decision because the actual location of the duct infrastructure was significantly different. In fact, the segment contained an HDD and, subsequently, a trenched segment back to the public road.


Reduct case study depth profile


Although this is an extreme case, all too often, as-built data stored in GIS platforms is as-planned/as-permitted data, or in case both of those are not available, a straight line between the nearest known manholes. At first sight, straight lines may appear plausible for HDD segments, but in reality, and with 20+ years of data to prove it, they hardly ever are!


For more information on the Reduct DR-2, click here.


Features and Benefits of 3D Gyroscopic Pipeline Mapping

Reduct 3D pipeline mapping

by Reduct

Reduct Gyroscopic Mapping


What is Gyroscopic Pipeline Mapping?


Gyroscopic pipeline mapping is a technique used within the utility pipeline construction and survey sectors to provide 3D geographical information on underground utility pipes and ducts.


As an autonomous Orientation Measurement Unit (OMU) passes through a pipe or duct, a range of inertial sensors captures its change in heading, inclination, and acceleration at high frequency.


The resulting 3D profile links to the pipe segment’s start and endpoint coordinates, and an as-built map is created, which can be immediately uploaded into any GIS platform.


Reduct gyroscopic map


Gyroscopic mapping of underground utility pipes uses:


• Damage prevention The lack of underground utility data is a significant cause of pipeline damage, injuries, death, environmental damage, and delays during civil engineering projects. Gyroscopic mapping of underground utilities improves the data quality of utility survey records. 


• Stress analysis Pressurized pipes typically must adhere to minimum bend radius specifications. Thanks to the high-frequency sampling rate, the standard bend radius calculation feature in the Reduct gyroscopic mapping solutions instantly yields highly accurate bend radius information.


• Flow management in gravity sewer systems As the name suggests, gravity is used in most sewers, and deformations resulting in localized sagging could lead to clogging of the pipe over time. That is why an inclination assessment of newly installed sewer systems before contractor handover or at periodic intervals of existing sewer systems is essential for optimal network management.


• Maintenance planning As policy demands, all utilities must be maintained and inspected periodically. However, the level of maintenance required may vary depending on the pipe’s condition or the soil surrounding it.


Sometimes a pipe can traverse several types of soil or is situated in an earthquake-prone area. Through periodic mapping, you can detect changes in pipeline subsidence at an early stage and redirect maintenance dollars to those areas where pipe movement is most severe.


Reduct gyroscopic mapping


Benefits of gyroscopic mapping technology

• Does not require aboveground tracing or tracking Gyro-mapping tools operate autonomously between entry and exit points.


• Can map at any depth Because tracing or tracking is not necessary, the probe can map deep-laying pipes, pipes crossing underneath rivers, highways, train tracks, or buildings with ease.


• Unaffected by groundwater level and electromagnetic interference A significant advantage over other types of locating technologies.


• Takes less than one hour to perform measurement Once the unit has run through the pipe four times, you can analyze the data on-site by uploading it to the field laptop.


• Samples at high frequency At 100Hz (100 samples per second), gyro mapping creates a very rich data set from which accurate and highly detailed positional and bend radius information can be derived.


Reduct Gyroscopic Mapping


When is the best moment to gyro-map underground utilities?


• Right after installation Mapping a pipe immediately after installation is the most cost-efficient moment in a pipe’s life cycle to obtain an accurate as-built. Besides the value as an independent technology to verify the contractor’s performance, it will also help protect your pipe from 3rd party damage during its remaining operational lifetime.


• Temporarily decommissioned utility pipes For existing pipelines with questionable as-built data, the best moment to map is during shutdowns for maintenance or repairs. The highly efficient operational procedures of gyro-mapping systems mean that the incremental shutdown time is minimal. Typically, you can map a 500m section of pipe in less than one hour.


To learn more, visit www.egwutilitysolutions.com/reduct.


Don’t take the risk, get it mapped!